Contents
- Linear Graph Layouts
- Extended Travelling Salesman Problem
- Minimum Linear Logarithmic Arrangement
- Non-Crossing Euclidean Steiner Forest
- Tangles
- Threshold-Coloring
Linear Graph Layouts
In a total order of the vertices of a graph, two edges with no endpoint in common can be crossing, nested, or disjoint. A k-stack (respectively, k-queue) layout of a graph consists of a total order of the vertices, and a partition of the edges into k sets of pairwise non-crossing (respectively, non-nested) edges. This page contains a detailed overview of open problems in the field. My favourite ones are as follows:
Stack Layouts:
-
Forest stack layout requires every page to be a forest. Confirm or reject a conjecture that every graph with stack number s admits
a forest stack layout on (s+1) pages.
See [Sch22].
-
Do k-planar graphs (\(k \ge 2\)) have bounded stack number? This is known for 1-planar graphs, and the best current upper bound is \(O(\log n)\).
Analysing 2-planar graphs is the natural first step.
- Do upward planar acyclic digraphs have bounded stack number? This is known for certain families of planar graphs.
-
Do graphs embeddable on a Klein bottle have bounded stack number?
See [Wood].
- What is the stack number of complete bipartite graphs?
Queue Layouts:
-
Reduce the gap between the lower bound of 4 and the upper bound of 49 for the queue number of planar graphs.
See [DJMMUW19] for the basic algorithm, and [BGR23] for an attempt to improve it (some arguments missing).
-
Is the queue number of graphs with treewidth k (aka k-trees) bounded by O(poly(k))? The known upper bound is 2k - 1 and lower bound is k + 1.
The question might be interesting for subclasses of k-trees, e.g., simple k-tree, 4-trees, k-caterpillars etc.
Mixed Layouts:
-
Is there a function f such that qn(G) ≤ f(sn(G)) for all graphs?
A possibly easier first questions is: Do cubic graphs with mixed 1-stack 1-queue layouts have a constant queue number? See [KKPU25] for latest on the topic.
-
Can mixed layouts with a fixed vertex order be characterized via forbidden patterns (analogously to twists/rainbows for stacks/queues)?
See [HMP24] for latest on the topic.
- What is the complexity of recognizing mixed (stack+queue) linear layouts?
Extended Travelling Salesman Problem
Let G = (V, E, w) be a directed weighted graph where an edge (s, t) ∈ E has a weight, w(s, t) > 0. The goal is to find an ordering of V, \(π : \{1, \dots, |V|\} \rightarrow V\), so as to maximize the following expression, called ExtTSP: $$ ExtTSP = \sum_{(s, t) \in E} w(s, t) \times \begin{cases} k_f\big(π(t) - π(s)\big) & \text{if } π(s) \le π(t)\\ k_b\big(π(s) - π(t)\big) & \text{if } π(s) > π(t)\\ \end{cases} $$ where the summation is taken over all edges of G and \(k_f, k_b: [0, |V|) \rightarrow \mathbb{R}\) are distance coefficients for forward and backward edges, respectively. Notice that the classical (maximum) Travelling Salesman Problem is an instance of ExtTSP when \(k_f(1) = 1\) and \(k_b(i) = 0\) for all \(i\). We assume that both \(k_f\) and \(k_b\) are decreasing functions, that is, short edges are more important for the objective than the long ones. We are particularly interested in the case when \(k_f(i) = k_b(i) = 0\) for all \(i \ge C\) for some constant \(C > 0\). See [3] for a practical instance of ExtTSP in the context of compiler optimization.
- Is there a (constant-factor) approximation algorithm or PTAS for the problem?
- Can the above problem be solved optimally on control flow graphs (e.g., having small treewidth)?
Minimum Linear Logarithmic Arrangement
A linear layout of a graph \(G = (V, E)\) with \(n = |V|\) vertices is a bijection \(π : V → \{1, . . . , n\}\). In practice it is desirable that “similar” vertices of the graph are “close” in \(π\). In the context of index compression, the following problem is defined: $$ \min \sum_{(u, v) \in E} \log|\pi(u) - \pi(v)| $$
It is known that the problem is NP-hard, see [4], but a number of questions remain open:- Is there a (constant-factor) approximation algorithm for the problem?
- Can the above problem be solved optimally for certain classes of graphs (e.g., trees or planar graphs)?
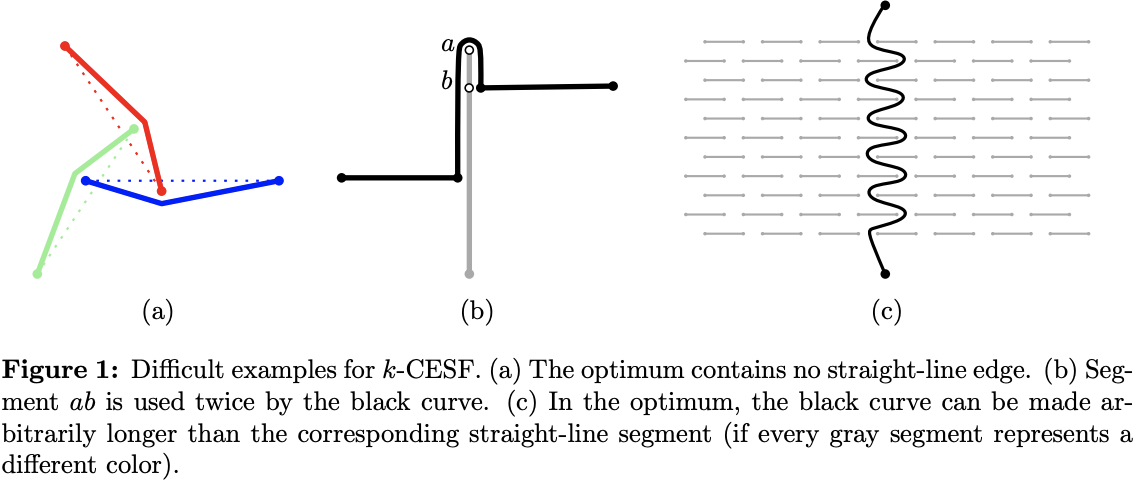
Non-Crossing Euclidean Steiner Forest
Given a set of k-colored points in the plane, we consider the problem of finding k trees such that each tree connects all points of one color class, no two trees cross, and the total edge length of the trees is minimized. For k = 1, this is the well-known Euclidean Steiner tree problem. For general k, two approximation algorithms with ratios \(O(\sqrt{n} \log k)\) and \(k + \epsilon\) are known, while for k = 2, there exists a PTAS; see [5].
- Is there a better (e.g., constant-factor) approximation algorithm for k > 3?
- Is the problem APX-hard for large k?
- Study an ``anchored'' version of the problem in which the only allowed Steiner points are input points of a different color.
- Find non-crossing tour of shortest length on a given ordered set of points.
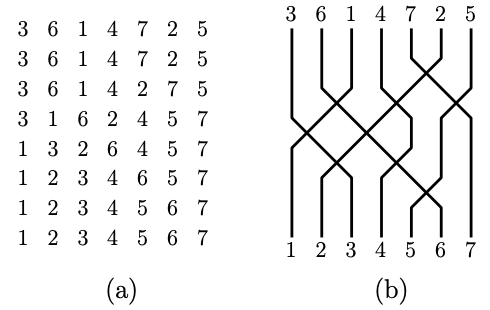
Tangles
A permutation may be represented by a collection of paths in the plane. We consider a natural class of such representations, which we call tangles, in which the paths consist of straight segments at 45 degree angles, and the permutation is decomposed into nearest-neighbour transpositions. We address the problem of minimizing the number of crossings together with the number of corners of the paths.
Tangles have been studied in [6] and [7]. A list of follow up questions:
- What is the complexity of determining the tangle with minimum corners for a given permutation? What is the complexity for simple tangles?
- Nice tangles with double crossings: Can one partition a permutation into 213- and 312-avoidable subpermutations?
- What is the asymptotic behavior as \(n → ∞\) of the maximum over permutations \(π ∈ S_n\) of the minimum number of moves among simple tangles that perform \(π\)? In particularly, is it \(O(n)\)? Our results show only that it is between \(3n − o(n)\) and \(O(n \log n)\).
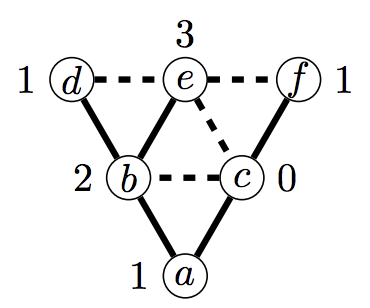
Threshold Coloring
In threshold-coloring of graphs, vertex colors represented by integers are used to describe any spanning subgraph of the given graph as follows. A pair of vertices with a small difference in their colors implies that the edge between them is present, while a pair of vertices with a big color difference implies that the edge is absent. A graph is called total-threshold-colorable if every subgraph of a given graph can be represented by some threshold-coloring.
Threshold-coloring have been studied in [1] and [2]. A list of follow up questions:
- What is the maximum density of a total-threshold-colorable graph? We conjecture such a graph contains at most 2n-3 edges.
- Is square grid total-threshold-colorable?
- Is every planar graph total-threshold-colorable in 2D, that is, when every vertex gets a pair of colors and the difference is computed using the Euclidean distance between the corresponding pairs?
Bundle Crossings
Refer to [1] and [2].Visual Graph Clustering Comparison
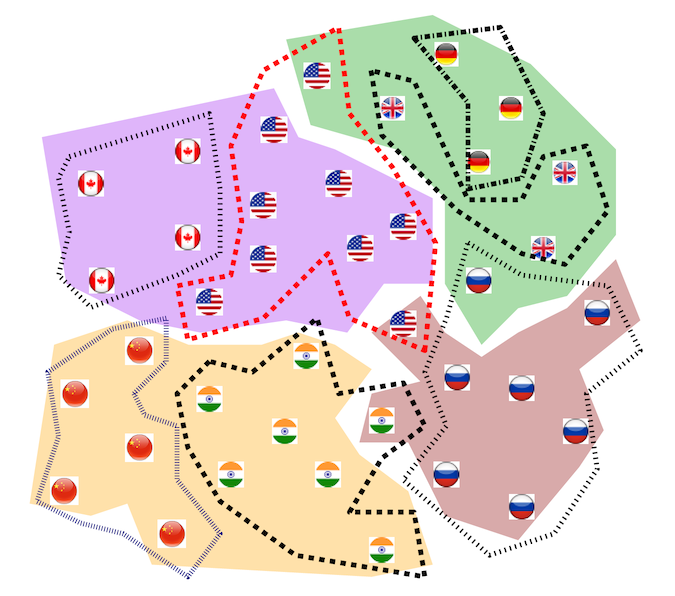
Graph clustering is a problem of partitioning a graph into a collection of disjoint sets of vertices. There are a many available clustering algorithms that may produce different results for the same dataset. In addition, many algorithms provide configurable parameter settings. Hence judging which clustering is the most meaningful with respect to a certain interpretation of the data must be done by a human expert, which may want to compare different clusterings visually. This motivates the problem of creating a technique for visual graph clustering comparison. The goal is to create a visualization that simultaneously represents two distinct clusterings of a given graph (or a set of objects).
One theoretical aspect of the problem has been studied in [1].
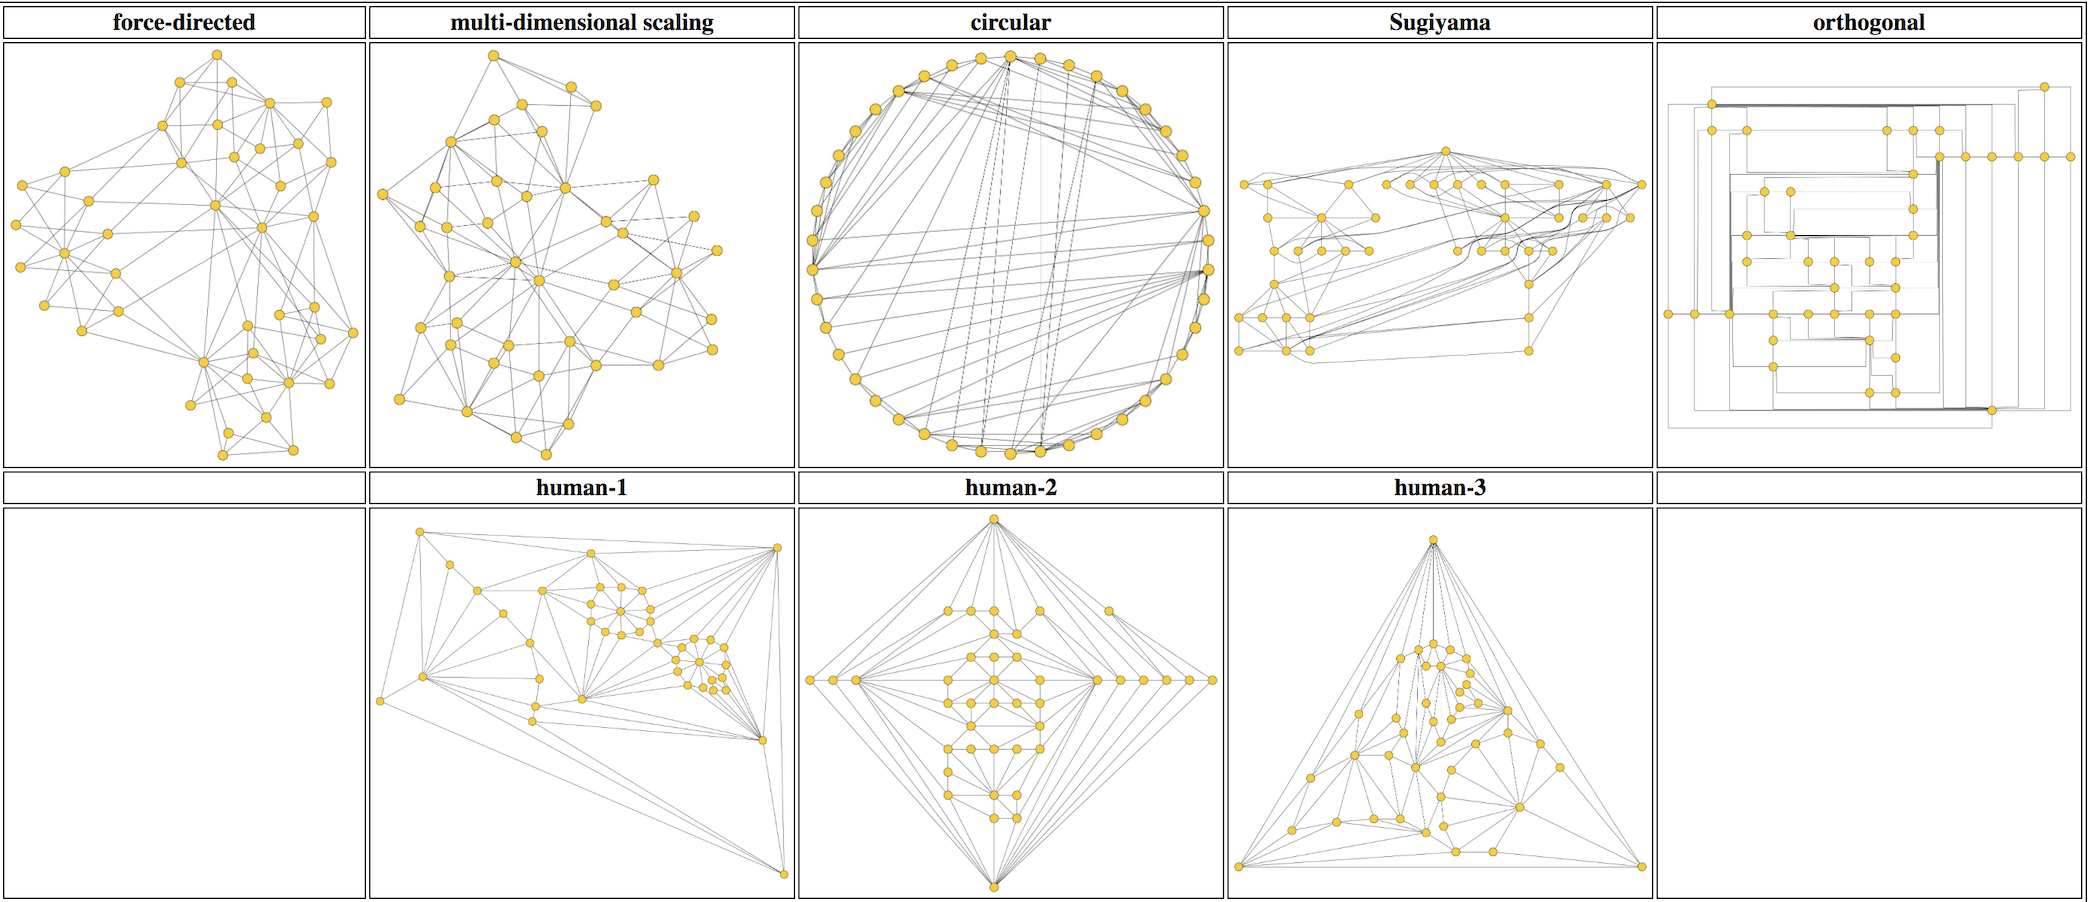
Practical Planar Graph Drawing
Given the same small/medium-sized graph, can an algorithm always produce a better drawing than a human? Despite the extensive research in the field of graph drawing, the answer is no: There are fairly simple graphs for which human-made visualizations are much better than automatically-generated ones. This holds even for highly structured graphs such as planar triangulations or quadrangulations. Thus we consider the problem of designing and implementing a practical algorithm for drawing planar graphs open.